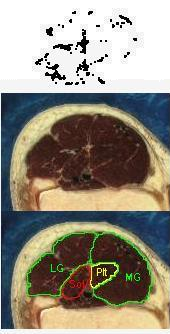
Each block of images shows a stereo pair of images showing the non-contractile tissues in the calf region of the leg. The images represent a 5 cm long muscle segment shaded from proximal (black) to distal (light gray), created from a stack of 50 axial sections. To the right are pairs of images showing the axial sections corresponding to the most proximal (black) region in the stereo pairs. The orientations of the two sets of images do not correspond. The white regions are the non-contractile tissues. The lower image identifies the soleus (Sol), plantaris (Plt), medial gastrocnemius (MG) and lateral gastrocnemius (LG) muscles in the section. The upper image plots (in black) the white regions of the section (masked for bone, skin and the muscle surfaces in some regions). The rightmost images also are a link to the raw data defining the x, y, z coordinates of every pixel identified as non-contractile tissue. A final column of this 4-column data contains the digit 2 for compatibility with the 3D rendering software, Viewworld which can be downloaded from http://pollux.usc.edu/~afrancoi/viewworld/. You can either click on the link and copy and paste the data, or right click and select the Save Link As popup to save the file to your computer. You will need to modify the display to reproduce the images shown here.

Image set 1: This is the most proximal region of the soleus muscle - approximately 0 - 50 cm of the soleus muscle.
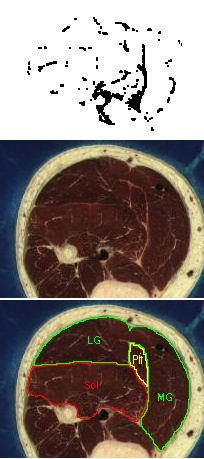
Image set 2: - approximately 50 - 100 cm of the soleus muscle. Note the pronounced taper of the deep and superficial soleus aponeuroses. Also note the complex network of non-contractile tissues in the gastrocnemius muscles.
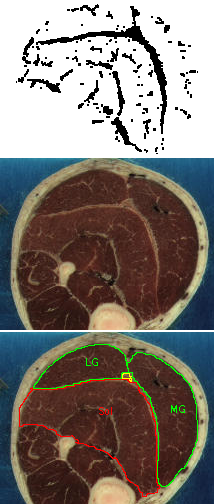
Image set 3: - approximately 100 - 150 cm of the soleus muscle. The network of intramuscular non-contractile tissue is clear in the soleus and gastrocnemius muscles. Note that they do not appear to be in contact with, or even in close prximity to the aponeuroses. Note also the concentric arrangement of the soleus aponeuroses around the median septum.
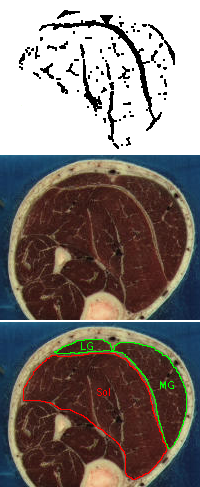
Image set 4: - approximately 150 - 200 cm of the soleus muscle. Note the change in the arrangement of the soleus aponeuroses with the median septum branching off the superficial aponeurosis and separating the two portions of the deep aponeurosis.
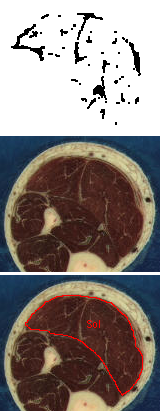
Image set 5: - approximately 200 - 250 cm of the soleus muscle. Note the median septum appears to divide the soleus into two compartments.
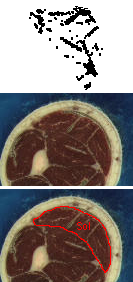
Image set 6: - approximately 250 - 300 cm of the soleus muscle.
Please read this whole of this paragraph before you try any of the links, The results are not perfect and are the data I most need help with, mostly getting the into a web-copatible form. Here is a small example of a portion of data translated to VRML: calf example and a very small VRML test file which shows a few data points rendered as elongated boxes. I have tested both with CORTONA, a 3D rendering add-in available from Parallel Graphics. The files are far from perfect. You will need to click on the 'fit' button to bring the image into view because I haven't yet figured out my 3D orientation or location. The rendered boxes are also supposed to be colored and lit. Unlimately, I would like to provide a complete 3D rendering which an investigator can manipulate to get a feel for the full 3D structure.